Claims Loss Ratio Forecasting Using Prophet

By Arusha Kelkar, Senior Data Scientist, September 2023

By Arusha Kelkar, Senior Data Scientist, July 2023
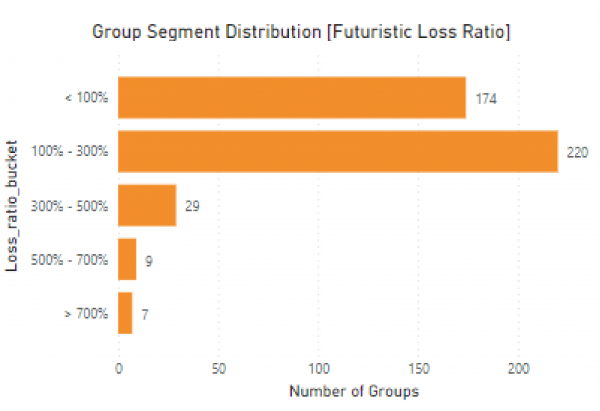
In an earlier blog, we explored the fundamentals of claims loss ratio and its importance in the insurance world. In the fiercely competitive insurance industry, accurate claims loss ratio forecasting is the linchpin of success. Claims loss ratio forecasting is critical for insurance providers, as it allows them to manage their risk exposure and maintain profitability in the face of changing risk factors. In this blog, we implement a time series forecasting model using Prophet library, that empowers insurance firms to gain unprecedented insights and increase profitability. Prophet’s prowess lies in dissecting complex time series data effortlessly, making it accessible to both novices and industry experts. Our case study, employing anonymized dental claims data, showcases the potential of using ML to improve operational decision-making. The forecast identifies groups with alarming loss ratios exceeding 400%, prompting strategic actions to optimize profits. By analyzing member data and investigating claim patterns, insurance firms can proactively enhance their policies, increase premiums wherever necessary and thrive in the dynamic insurance landscape. As we strive for continuous improvement, fine-tuning the model and adding essential regressors will further elevate forecast accuracy. Embrace the power of advanced data science techniques and embark on a data-driven journey to unlock your insurance firm’s full potential for sustainable growth and unrivaled success using Constellation4 as your data partner. The future of claims loss ratio forecasting starts here.

Prophet is an open-source time series forecasting library developed by Facebook’s Core Data Science team. It provides a simple and intuitive approach to forecasting univariate time series data, making it accessible to both beginners and experienced practitioners.
Prophet is particularly useful for forecasting problems where the data exhibit strong seasonality patterns, such as daily, weekly, or yearly trends. It employs an additive model that decomposes the time series into three main components: trend, seasonality, and holidays (if applicable). The model assumes that future values can be estimated as the sum of these components.
Some advantages of using Prophet are:

Accommodates seasonality with multiple periods


It’s worth noting that Prophet is not specifically designed for claims loss ratio forecasting, which typically involves more complex models. However, it can be a good starting point for initial analysis or as a benchmark against more sophisticated approaches in the industry.
The data we have used for the use case is anonymized dental claims data. The granularity of the data is claims paid amount and premium amounts paid per month per group.
1.
2.
3.

We have data for around 800 groups, which we first filter on the following conditions
1.
2.
3.
The forecast was done from end of September 2022 to August 2023.
Loss Ratio = (Total paid amount in claims)/(Total premium received from the groups)
With 3 years of available data for groups, we implemented the bottom-up time series forecasting technique to forecast claims paid amount and premium for all the groups individually and then aggregated it for the total forecast. Since premium has a monthly frequency of being paid, we constructed a monthly forecast. For preparing the data, we filled in the missing values with average of previous and the coming months. Groups with insufficient historic data were excluded for the forecast. To calculate the loss ratio for each group, we created 2 forecast models for forecasting paid amount and premium paid per month. We experimented with different forecasting approaches like ARIMA, AR, etc. and after careful evaluation of accuracy, we decided to go forward with Prophet. The model performance was extensively evaluated using hyperparameter tuning. We looked at various parameters like seasonality_mode, changepoint_prior_scale, holidays_prior_scale and n_changepoints for hyperparamter tuning and selecting models with best accuracy (highest MAPE – Mean Absolute Percentage Error).

1.


2.
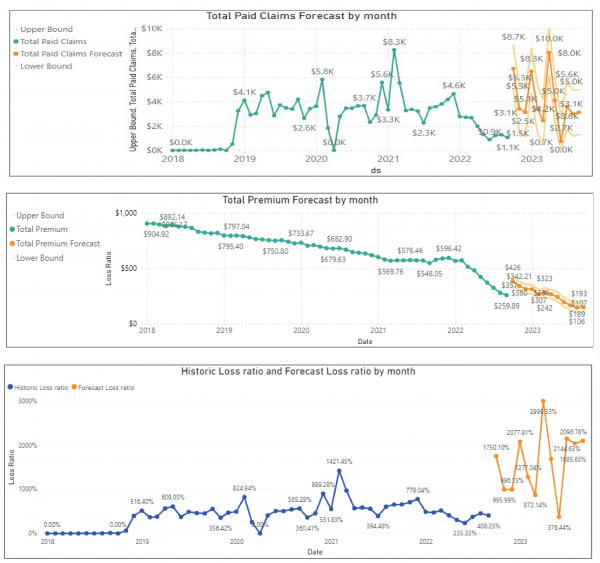
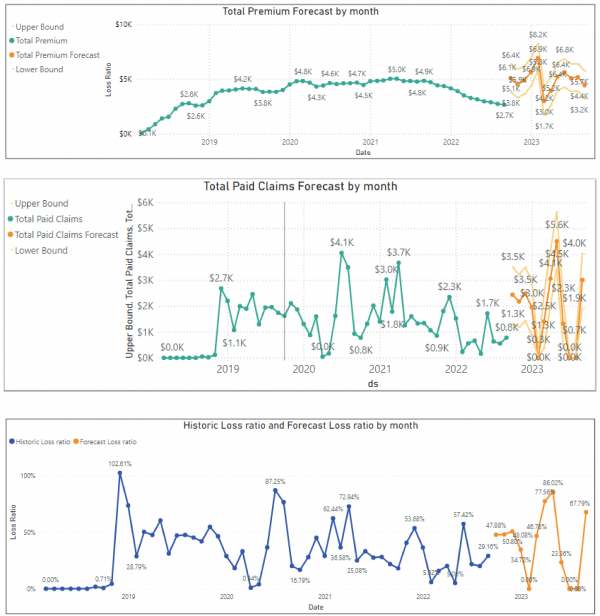
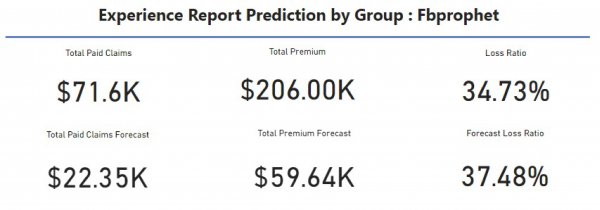
An example of forecasted premium and paid claims for a group – ‘test_group’ is as follows. These groups lie in the <100% loss ratio bucket. This is an example of a group which is resulting in a profit currently for the business.


3.


Overall, the use of advanced machine learning techniques in claims loss ratio forecasting provides valuable insights for insurance companies to better understand their business, make data-driven decisions on premium adjustments, and ultimately increase profitability. For groups with higher forecasted claims loss ratios, strategic measures regarding premiums need to be enforced to improve business profitability. There is a huge potential in using advanced Machine learning techniques to forecast claims loss ratios in the healthcare industry. Moreover, tools like Power BI and Prophet help the business user understand the forecast and play around with the data to make operational decisions.
As read in this study, Constellation4 is well equipped to contribute productively to the healthcare insurance industry’s forecasting efforts. Our team stays up to date on technology development in order to build innovative solutions for the healthcare insurance industry.
If you have any questions regarding how Constellation4 can assist your company, please email us at c4marketing@constellation4.com or contact us on our online form.

