Schedule A Consultation
Get started with a free review of your product roadmap and goals.
SELF-SERVICE HEALTHCARE ANALYTICS
Schedule A Consultation
Get started with a free review of your product roadmap and goals.
Healthcare analytics has become an integral part of the healthcare industry with the ability to influence major decision making around improvement of patient outcomes, enhancing diagnostic accuracy and supporting value-based care. Meaningful insights from electronic health records, insurance records and claims data has helped a lot of organizations make accurate business decisions. However, legacy healthcare analytical and reporting processing and technologies have been constrained by many issues, including: data delays, spreadsheets, CSVs, text data dumps, manual data cleaning and reconciliations, and hard to replicate manually build analysis processes from raw data. Constellation4 team has been working with payers and providers to resolve many of these constraints through smarter data and analytics automations. Further, COVID19 has accelerated the digitization of healthcare products and services which necessitates faster access to accurate data and analytics. An optimally built self-service healthcare analytics platform along with supporting business and technology processes can result in faster data operations for payers, providers and patients.
Case Study
100+ ready to use customizable self-service use cases across the organization.*
Benefits
- External customers such as Group Administrators, Health Plans, Compliance, Providers and Patients can
get access to accurate information when they need it in the required format.
- Healthcare Executives are able to have operational dashboards at their fingertips that allow them to run
their business units/departments for managing daily KPIs.
- Business users can run analytics scenarios by themselves for their primary data and decision needs.
- Business users can create new reports from datasets by themselves based on their level of expertise.
- Business users can do custom actions with relevant data as per their job responsibilities.
- Healthcare Data and Analytics team including Data Engineers, Data Analysts and Data Scientists are
continuously enabling self-service analytics use cases.
Benefits
- External customers such as Group Administrators, Health Plans, Compliance, Providers and Patients can get access to accurate information when they need it in the required format.
- Healthcare Executives are able to have operational dashboards at their fingertips that allow them to run their business units/departments for managing daily KPIs.
- Business users can run analytics scenarios by themselves for their primary data and decision needs.
- Business users can create new reports from datasets by themselves based on their level of expertise.
- Business users can do custom actions with relevant data as per their job responsibilities.
- Healthcare Data and Analytics team including Data Engineers, Data Analysts and Data Scientists are continuously enabling self-service analytics use cases.
Data Quality & Reconciliation
- Provider Set Up and Directories
- Integration with Pure4 Data
- Claims Payment Reconciliation
- Enrollment Data Quality Analysis
- Pass Through Expense Modeling
Financial & Operating Performance Analytics
- Provider Affiliation Network Tracking
- Commercial Experience Report
- Medicare Profitability Analysis
- In-Force Enrollment Trend
- In-force Enrollment Trend
- Provider Contracting Turnaround
Advanced Modeling & Automation
- Provider Network Penetration and Value Modeling
- HEDIS Campaign Management
- Commercial Premium Optimizer
- Provider Fee Schedule Pricing
Solution
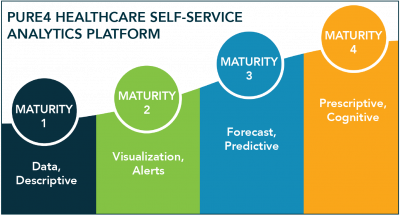
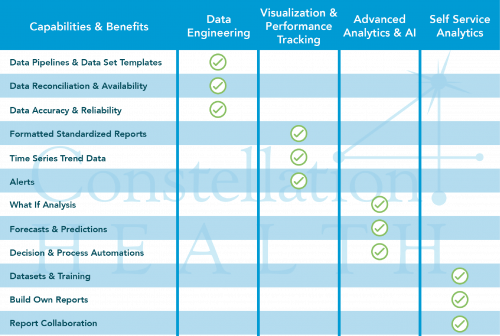
Constellation4 offers a comprehensive solution for implementation of healthcare analytics, self-service analytics being the highest level of advancement. The tool has capabilities to go through the entire journey of getting meaningful insights from data.
Step 1: Identify High Priority Use Cases for Business
- Identify the data strategy and data maturity levels for business organization, department and business
processes.
- Build a list of use cases and prioritize them based on business value and delivery complexity

Step 2: Design Self-Service Data Marts, Data Warehouse and Lake Houses
- Combine Kimbal (Bottom-up) and Inmon (Top-Down) data warehousing design models to take advantage
of speed of Kimbal and design robustness of Inmon approach.
- Create a standardized data architecture and data engineering deployment framework for productionized data
pipelines.
- Create data governance, data quality management and data security processes.
- Design flattened data set tables, views, functions on denormalized and normalized data structures
depending on performance needs and data sizes.
- Create a high speed and nimble data pipeline deployment mechanism for proof of concepts, adhoc
analysis using large data and urgent data requests.
Solution
Constellation4 offers a comprehensive solution for implementation of healthcare analytics, self-service analytics being the highest level of advancement. The tool has capabilities to go through the entire journey of getting meaningful insights from data.
Step 1: Identify High Priority Use Cases for Business
- Identify the data strategy and data maturity levels for business organization, department and business processes.
- Build a list of use cases and prioritize them based on business value and delivery complexity.

Step 2: Design Self-Service Data Marts, Data Warehouse and Lake Houses
- Combine Kimbal (Bottom-up) and Inmon (Top-Down) data warehousing design models to take advantage of speed of Kimbal and design robustness of Inmon approach.
- Create a standardized data architecture and data engineering deployment framework for productionized data pipelines.
- Create data governance, data quality management and data security processes.
- Design flattened data set tables, views, functions on denormalized and normalized data structures depending on performance needs and data sizes.
- Create a high speed and nimble data pipeline deployment mechanism for proof of concepts, adhoc analysis using large data and urgent data requests.
Data Platform Set Up Experience
- Data warehouses & DBs: SQL Server, Postgres, MongoDB, Azure DW, AWS Redshift, Snowflake, Oracle.
- DataLake & Lakehouses: Hadoop, Spark, Airflow, AWS Glue, AWS EMR, Databricks, Azure Synapse Analytics.
- Analytics & BI: PowerBI, Tableau, Python, R.
- Data Science: Azure ML Studio, AWS SageMaker, Databricks ML, Spark ML.
Step 3: Build Self-Service Datasets, Reports
- Design two-dimensional data model for each data set, add calendar table for time series and add measures/
calculated fields dataset to each report. Claims payment analysis illustration requires two datasets, one to track claims adjudication process and the other to track payment activity.
- Design different types of report pages. The report pages would include multiple Canned Reports,
Personalization enabled reports, Paginated/ Formatted reports along with data glossary and Ask a question pages. In the claims payment analysis illustration to the right, there are 6 canned report pages including payment trend, check run, general ledger, late payment, claim check recon and days to analysis.
- Build Canned report pages for specific purposes, selected performance indicator monitoring and required
level of detail. Sample to the right shows report created to track claims where the processing and payment activity is late.
- Enable personalization for various attributes of the report supported by underline BI too. This illustration
would let user change visualization type, Legend, Values, Details and Tool tips.
- Design centralized data glossary tables across curated data sets. Build a data glossary page in each report
to provide definitions of business terms, technical terms and exceptions/ rules used in the calculation inside each report.
Step 4: Define Executive User, External User and Self-Service Business User Levels. Build Training and Communication Process.
External User
- Create row and column level security on the data set as per the requirements.
- Add external users as guest users to individual pages or reports.
- Send an email with access links to the report for new updates and changes.
Executive User
- Build and allow access to all related self-service datasets at one place.
- Build landing pages and landing dashboard for each department. Below is an example of Executive
dashboard to display profitability information.
- Design executive alerts, automated emails with report attachments to save time for executives.
Internal Self-Service User
- Create specific features in the use cases according to the self-service business user level.
- Create training paths for business users based on their roles, organization strategy and potential.
- Carry out training sessions for users from varied business teams.
- Hold regular office-hours for different business teams to resolve any issues.
These levels show recommended user levels for using Power BI tool. These levels can be generalized for any BI tool depending on the features available in the tool.
User Level 1: Use Canned Reports
- Power BI usability features: filtering, sorting, using tables, visualization, sharing reports, bookmark pages,
use discussions, copy reports, data downloads, alerts, finding the right reports alerts.
- No dataset modeling knowledge required.
- Access reports from the service using UI.
User Level 2: Personalize A Report
- Personalize reports: change visualization data points on existing report.
- Understand 2D and simple dataset modeling.
- Power BI development basics.
- Dimensions vs measures.
- Summary stats/formulas: distinct, sum, average, count.
- Different fundamental chart types and usage.
User Level 3: Build New Report
- Create Power BI report with existing data sets.
- Understand advanced data set modeling and relationships.
- Time series data.
- Effective date, termination date.
- Power BI and SQL development.
- Reading excel data into Power BI.
- Write SQL query in Power BI desktop to build reports.
User Level 4: Build New Production Report
- Create Power BI report with new production data sets.
- Work with data engineer to get data in right format.
- Data analysis and quality testing.
- Define and build KPI calculations with DAX.
- Design/ develop/ deploy reports.
- Advanced Power BI and SQL.
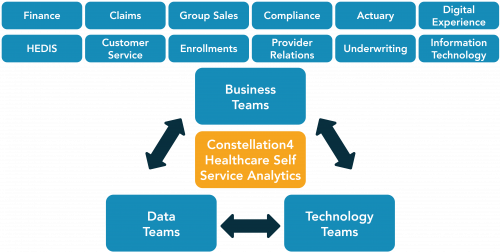
Step 5: Receive Continuous Feedback and Enhance Collaboration Between Business, Data and Technology

The success of technological tools used for business enhancement depends a lot on regular and consequential feedback. At Constellation4 Health, we believe that constructive feedback can go a long way in making our products user-friendly, contemporary and impactful.
- Divide the reporting process into Data Engineering and Report creation phases.
- Meet regularly with business teams to understand their take on the reports and the development till date.
- Follow super agile methodologies for development and testing with respect to the business operation.
- Document and work on feedback from business users regularly and talk through the intricacies of the
problem at hand.
- Come up with enhanced and technologically advanced solutions with improvised business understanding.

Step 3: Build Self-Service Datasets, Reports
- Design two-dimensional data model for each data set, add calendar table for time series and add measures/ calculated fields dataset to each report. Claims payment analysis illustration requires two datasets, one to track claims adjudication process and the other to track payment activity.
- Design different types of report pages. The report pages would include multiple Canned Reports, Personalization enabled reports, Paginated/ Formatted reports along with data glossary and Ask a question pages. In the claims payment analysis illustration to the right, there are 6 canned report pages including payment trend, check run, general ledger, late payment, claim check recon and days to analysis.
- Build Canned report pages for specific purposes, selected performance indicator monitoring and required level of detail. Sample to the right shows report created to track claims where the processing and payment activity is late.
- Enable personalization for various attributes of the report supported by underline BI too. This illustration would let user change visualization type, Legend, Values, Details and Tool tips.
- Design centralized data glossary tables across curated data sets. Build a data glossary page in each report to provide definitions of business terms, technical terms and exceptions/ rules used in the calculation inside each report.
Step 4: Define Executive User, External User and Self-Service Business User Levels. Build Training and Communication Process.
External User
- Create row and column level security on the data set as per the requirements.
- Add external users as guest users to individual pages or reports.
- Send an email with access links to the report for new updates and changes.
Executive User
- Build and allow access to all related self-service datasets at one place.
- Build landing pages and landing dashboard for each department. Below is an example of Executive dashboard to display profitability information.
- Design executive alerts, automated emails with report attachments to save time for executives.
Internal Self-Service User
- Create specific features in the use cases according to the self-service business user level.
- Create training paths for business users based on their roles, organization strategy and potential.
- Carry out training sessions for users from varied business teams.
- Hold regular office-hours for different business teams to resolve any issues.
These levels show recommended user levels for using Power BI tool. These levels can be generalized for any BI tool depending on the features available in the tool.
User Level 1: Use Canned Reports
- Power BI usability features: filtering, sorting, using tables, visualization, sharing reports, bookmark pages, use discussions, copy reports, data downloads, alerts, finding the right reports alerts.
- No dataset modeling knowledge required.
- Access reports from the service using UI.
User Level 2: Personalize A Report
- Personalize reports: change visualization data points on existing report.
- Understand 2D and simple dataset modeling.
- Power BI development basics.
- Dimensions vs measures.
- Summary stats/formulas: distinct, sum, average, count.
- Different fundamental chart types and usage.
User Level 3: Build New Report
- Create Power BI report with existing data sets.
- Understand advanced data set modeling and relationships.
- Time series data.
- Effective date, termination date.
- Power BI and SQL development.
- Reading excel data into Power BI.
- Write SQL query in Power BI desktop to build reports.
User Level 4: Build New Production Report
- Create Power BI report with new production data sets.
- Work with data engineer to get data in right format.
- Data analysis and quality testing.
- Define and build KPI calculations with DAX.
- Design/ develop/ deploy reports.
- Advanced Power BI and SQL.
Step 5: Receive Continuous Feedback and Enhance Collaboration Between Business, Data and Technology

The success of technological tools used for business enhancement depends a lot on regular and consequential feedback. At Constellation4 Health, we believe that constructive feedback can go a long way in making our products user-friendly, contemporary and impactful.
- Divide the reporting process into Data Engineering and Report creation phases.
- Meet regularly with business teams to understand their take on the reports and the development till date.
- Follow super agile methodologies for development and testing with respect to the business operation.
- Document and work on feedback from business users regularly and talk through the intricacies of the problem at hand.
- Come up with enhanced and technologically advanced solutions with improvised business understanding.

How To Get Started
Contact us to schedule a demo and complimentary discovery session to understand current status of your data journey and how Constellation4 Health can partner with you to take your organization to the next level using the self service analytics platform and processes. Email us or go to contact us online.
Author
Constellation4 Health is a Healthcare technology company providing innovative and scalable solutions for leading Health Insurance Payers and Providers. Solutions include:
Healthcare Analytics
Automate and mature your data platform, business intelligence, data science, and AI with Constellation4 Health self service analytics platform and processes. We have over 100 Use Cases including claims reconciliation, profitability analysis, and HEDIS Campaign Management.
Provider Data Management
A single source of truth for provider data powered by a Data as a Service platform that ensure 92% data accuracy compared to an industry standard of 52%.
Provider Network Management
Reimagining the workflows between payers and providers is a must to create sustainable payer models. A complete contact to contract platform powered by Salesforce.
Referral Care Coordination
Our seamless physician to physician referral platforms grows market share, prevents leakage and enables providers to have complete visibility on patient status.


